William Tyler Bradley
Posts
About
Genuary 2026
Generative Art for January 2026
Feb 1, 2026
Country Maps
A map of each country for flash cards
Oct 18, 2025
Grid Tilings
Tilings based on Multigrids
Sep 3, 2025
Google Cloud - Cloud Digital Leader Certification Flashcards
Flashcards for the Cloud Digital Leader Certification
Jun 21, 2025
Poisson Disk Sampling
Roughly evenly-spaced repeating points
Nov 11, 2024
Generative Art Twitter Bot with R and GitHub Actions
Automatic art generated daily
Sep 15, 2022
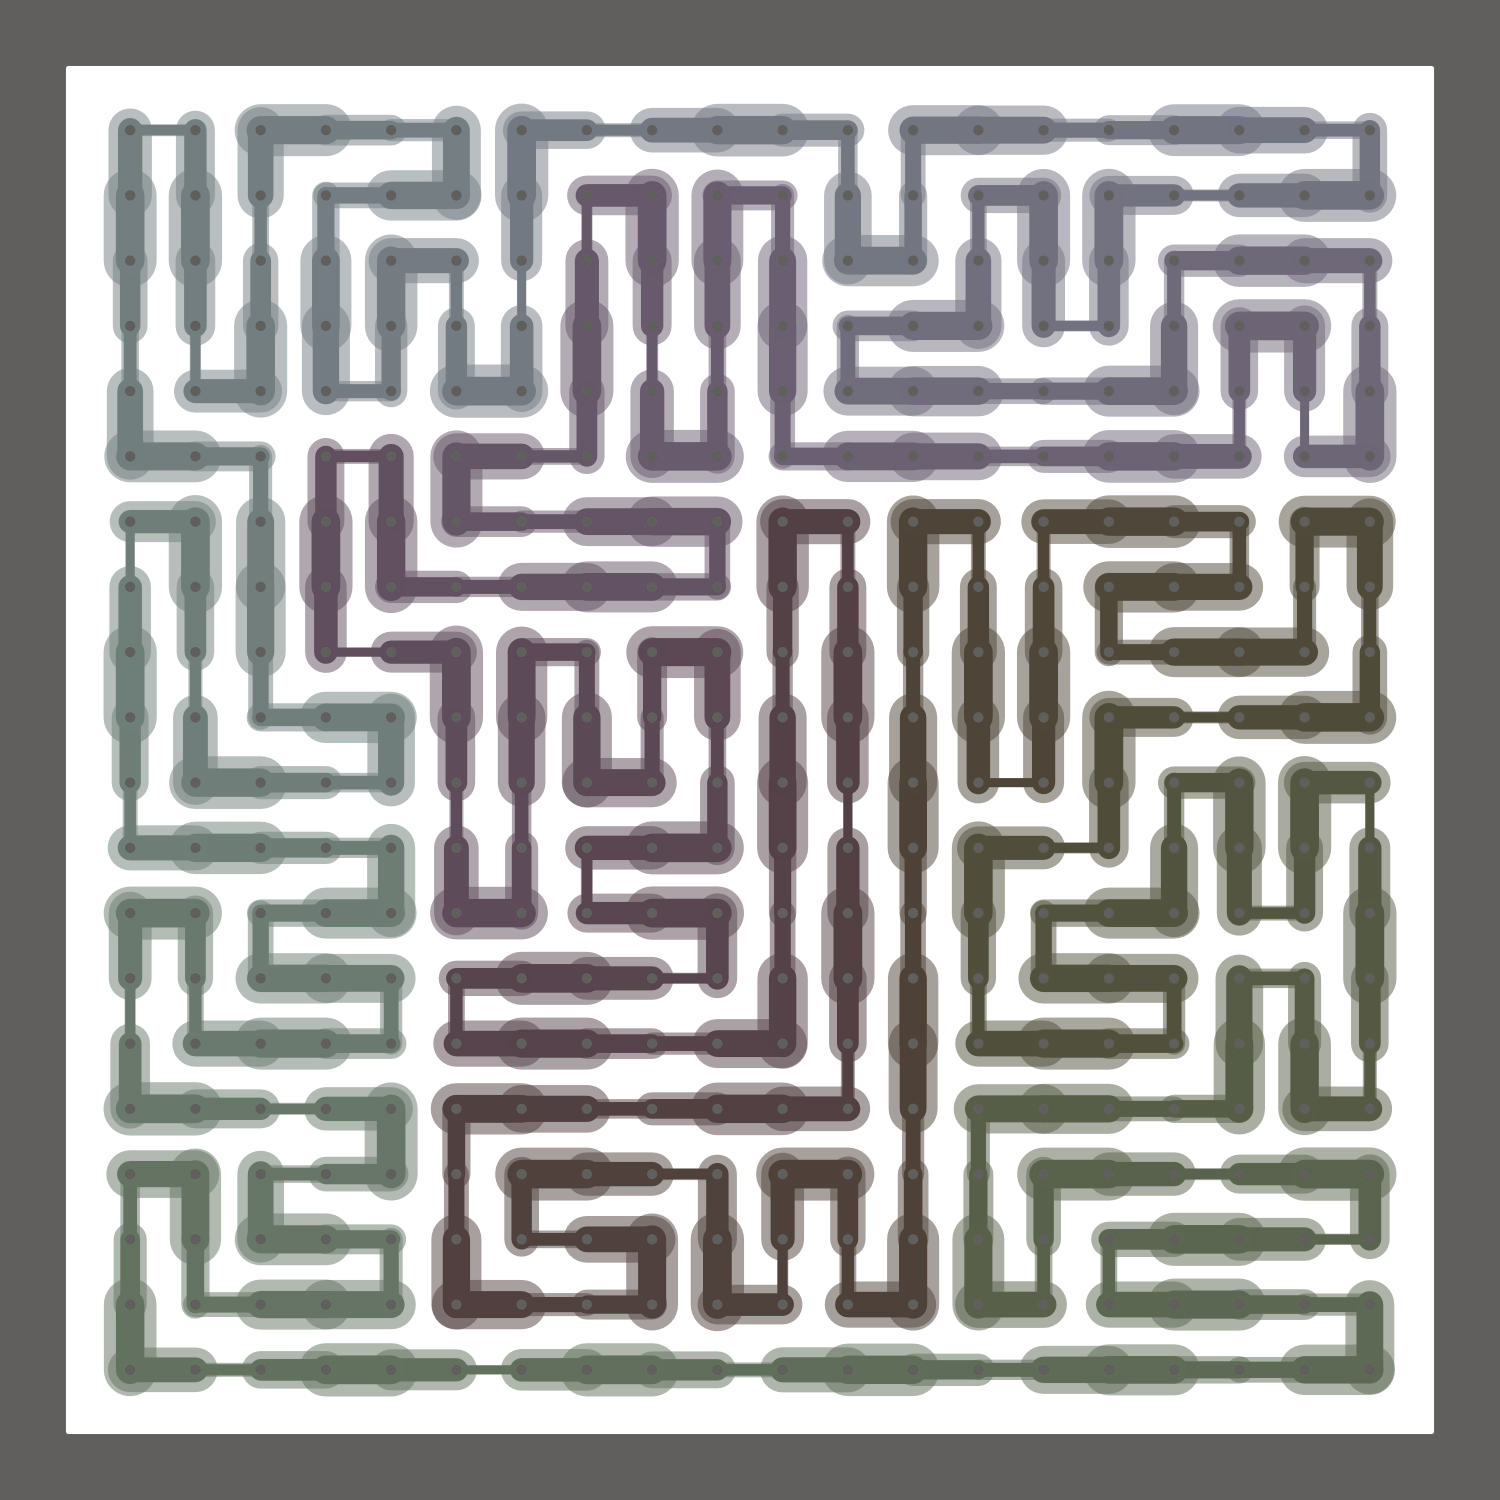
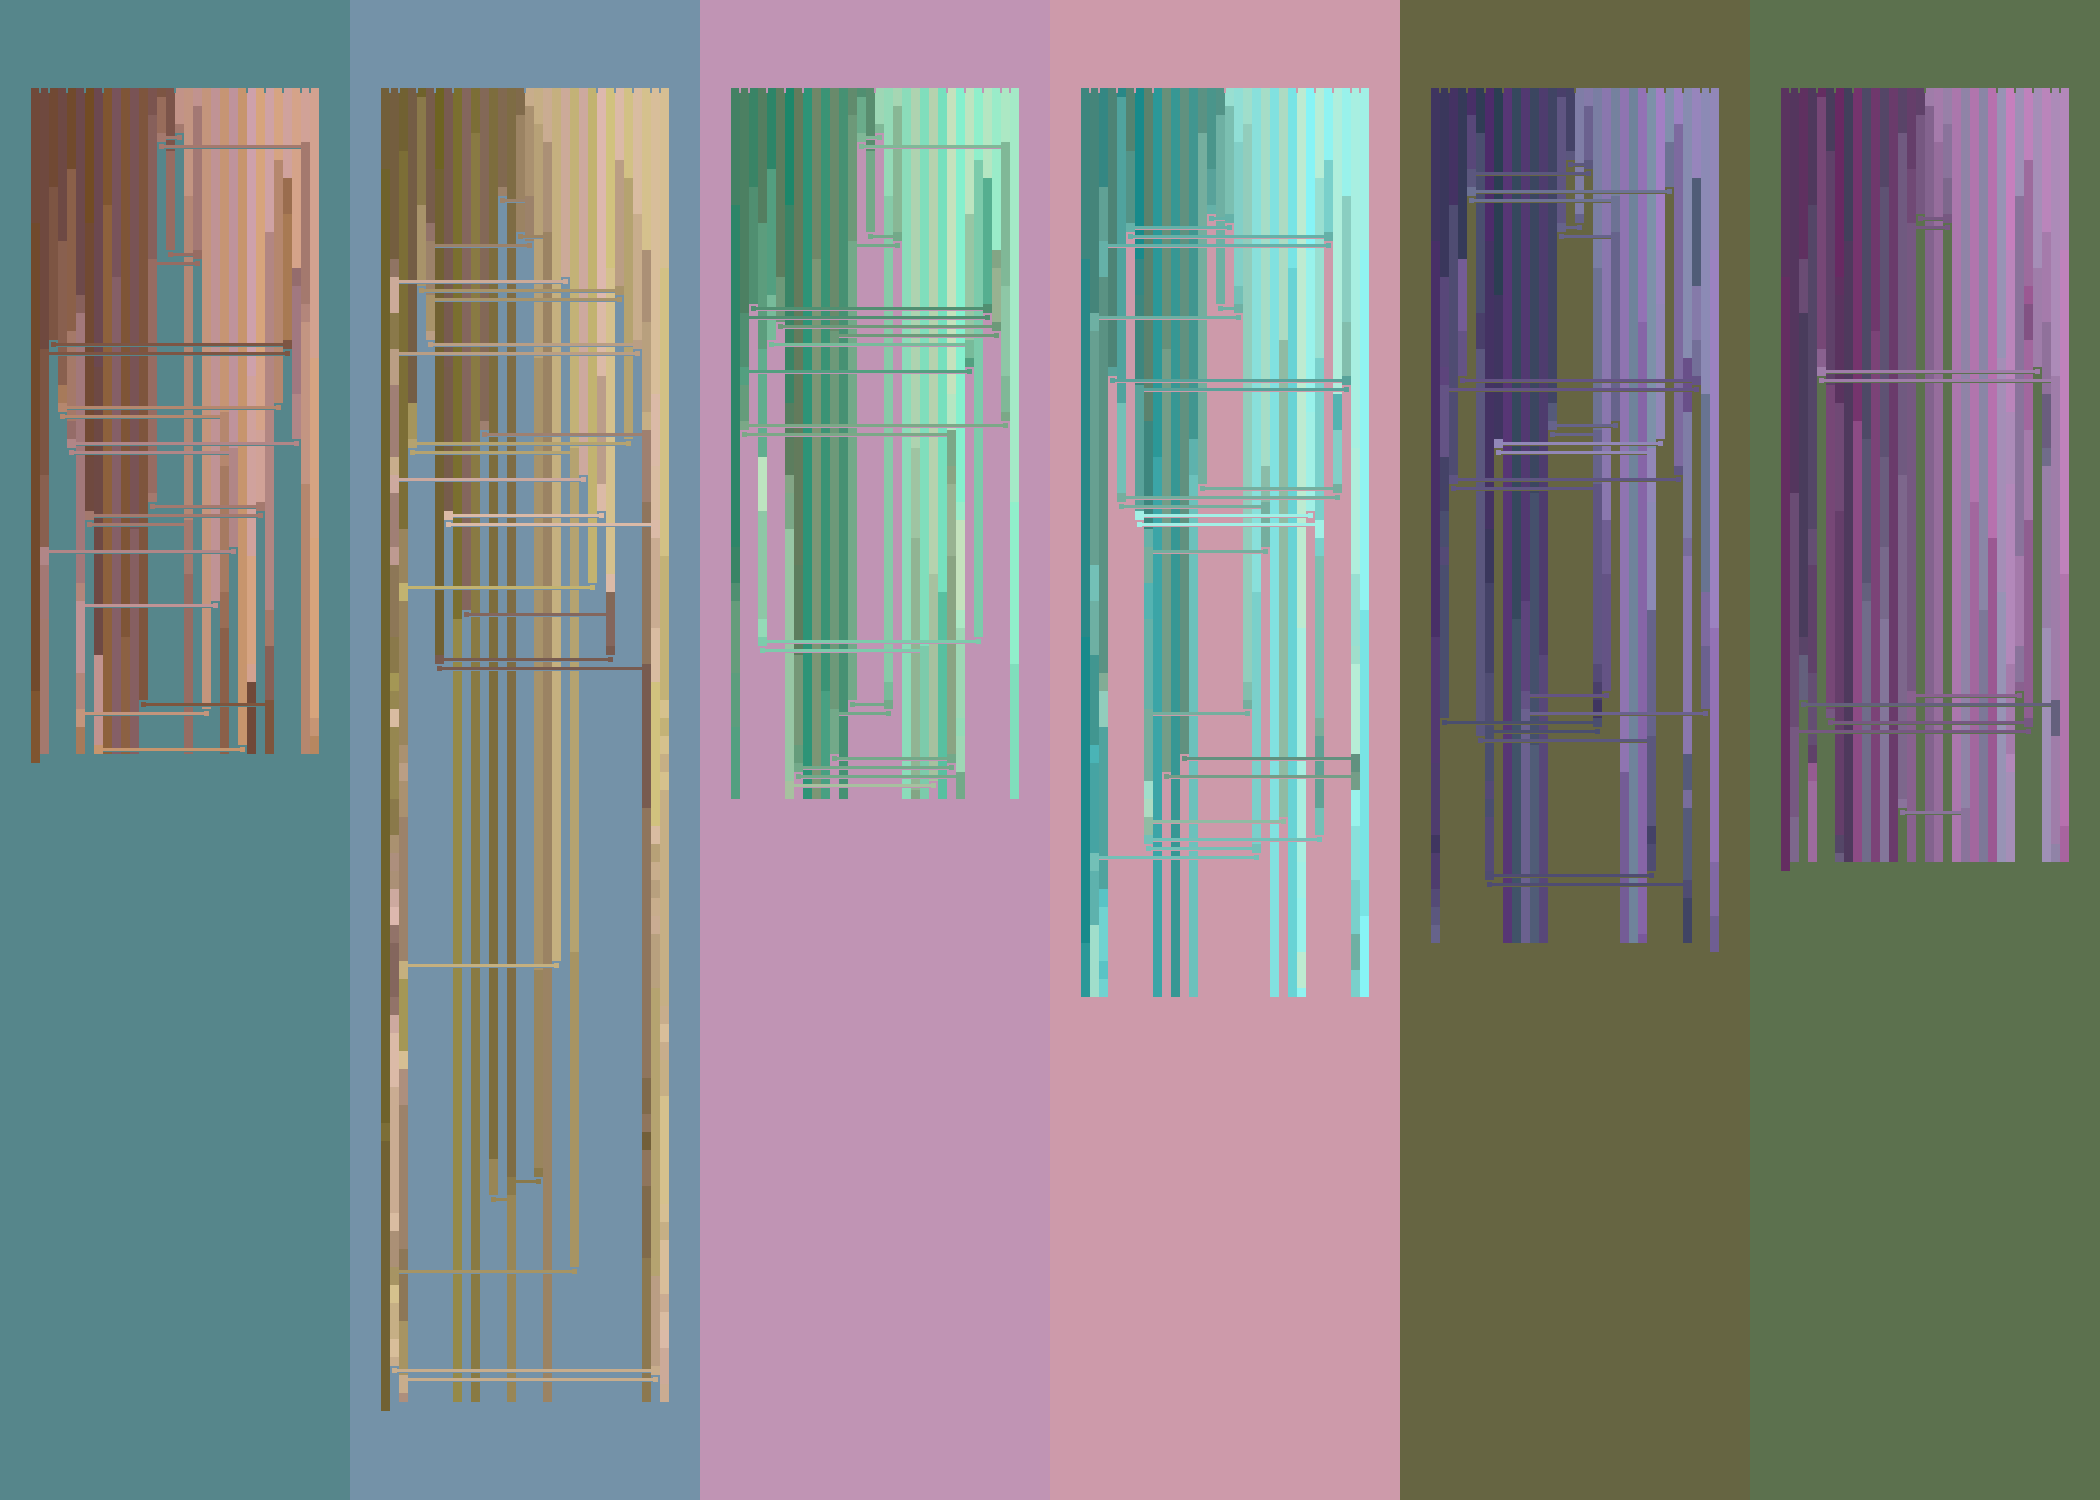
Circuitry
Generative art project based on a looped path
May 28, 2022
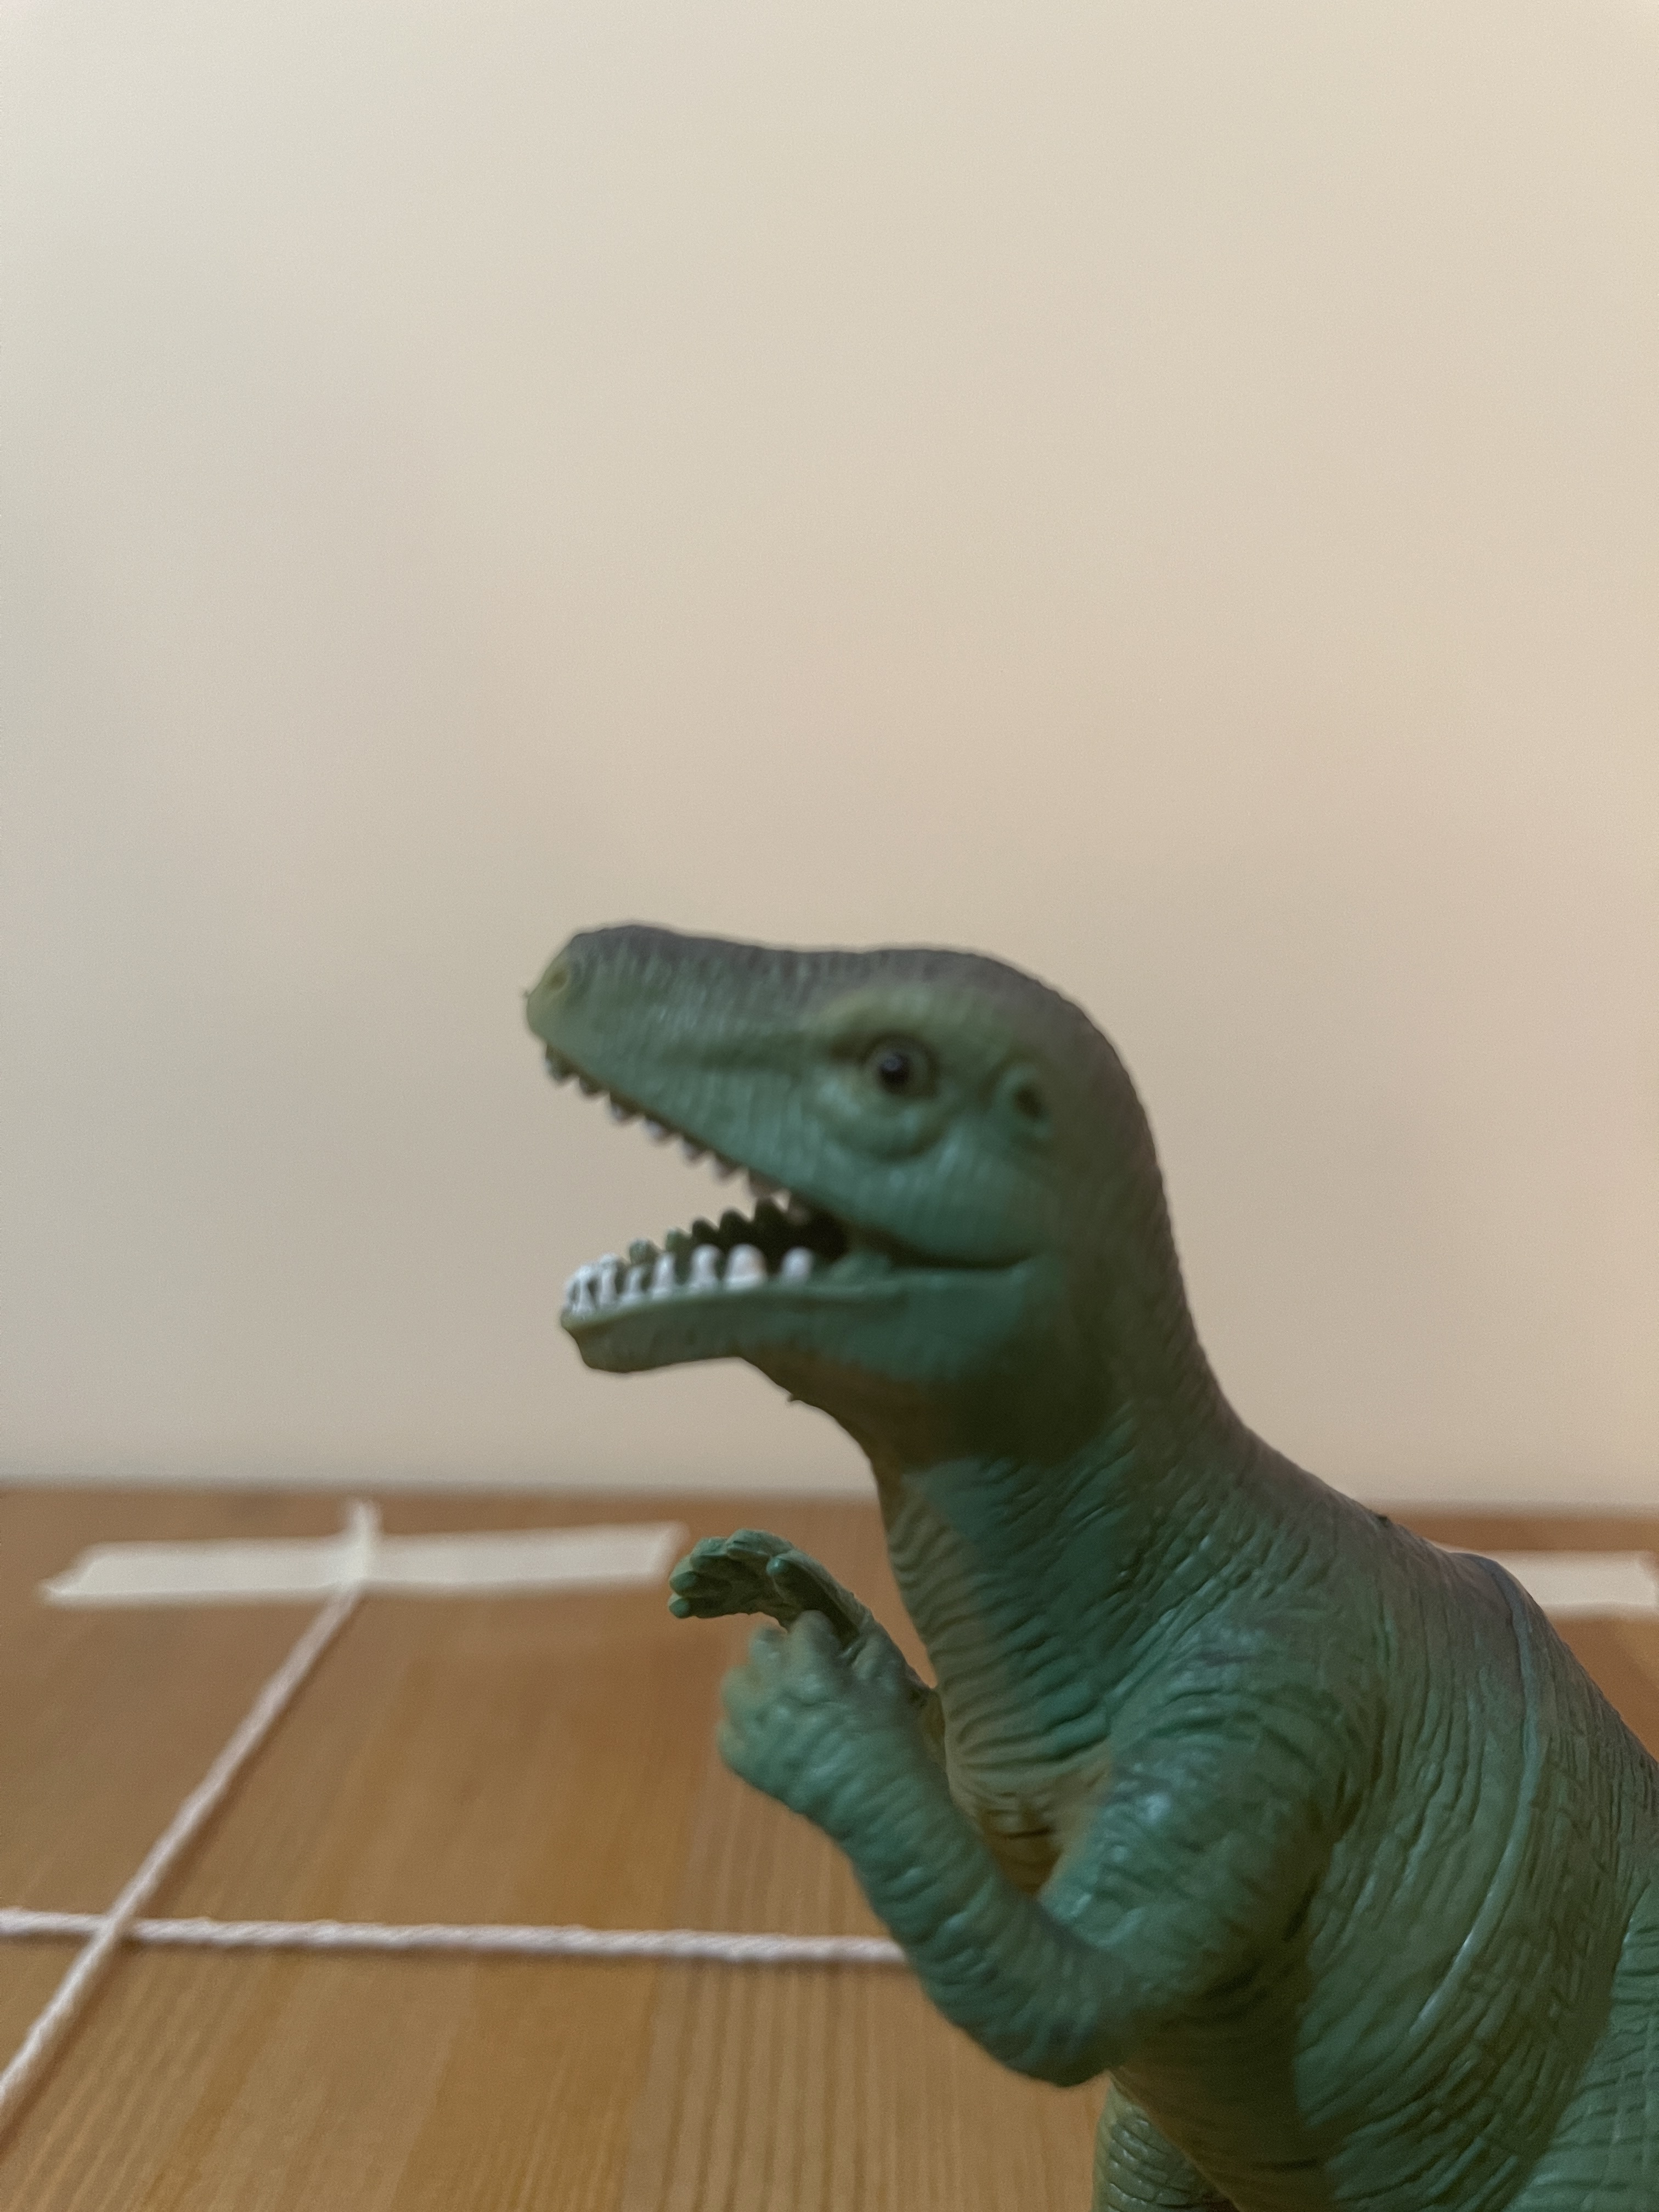
Cross-validation: A Toy Example
Presentation on cross-validation using toys
May 20, 2022
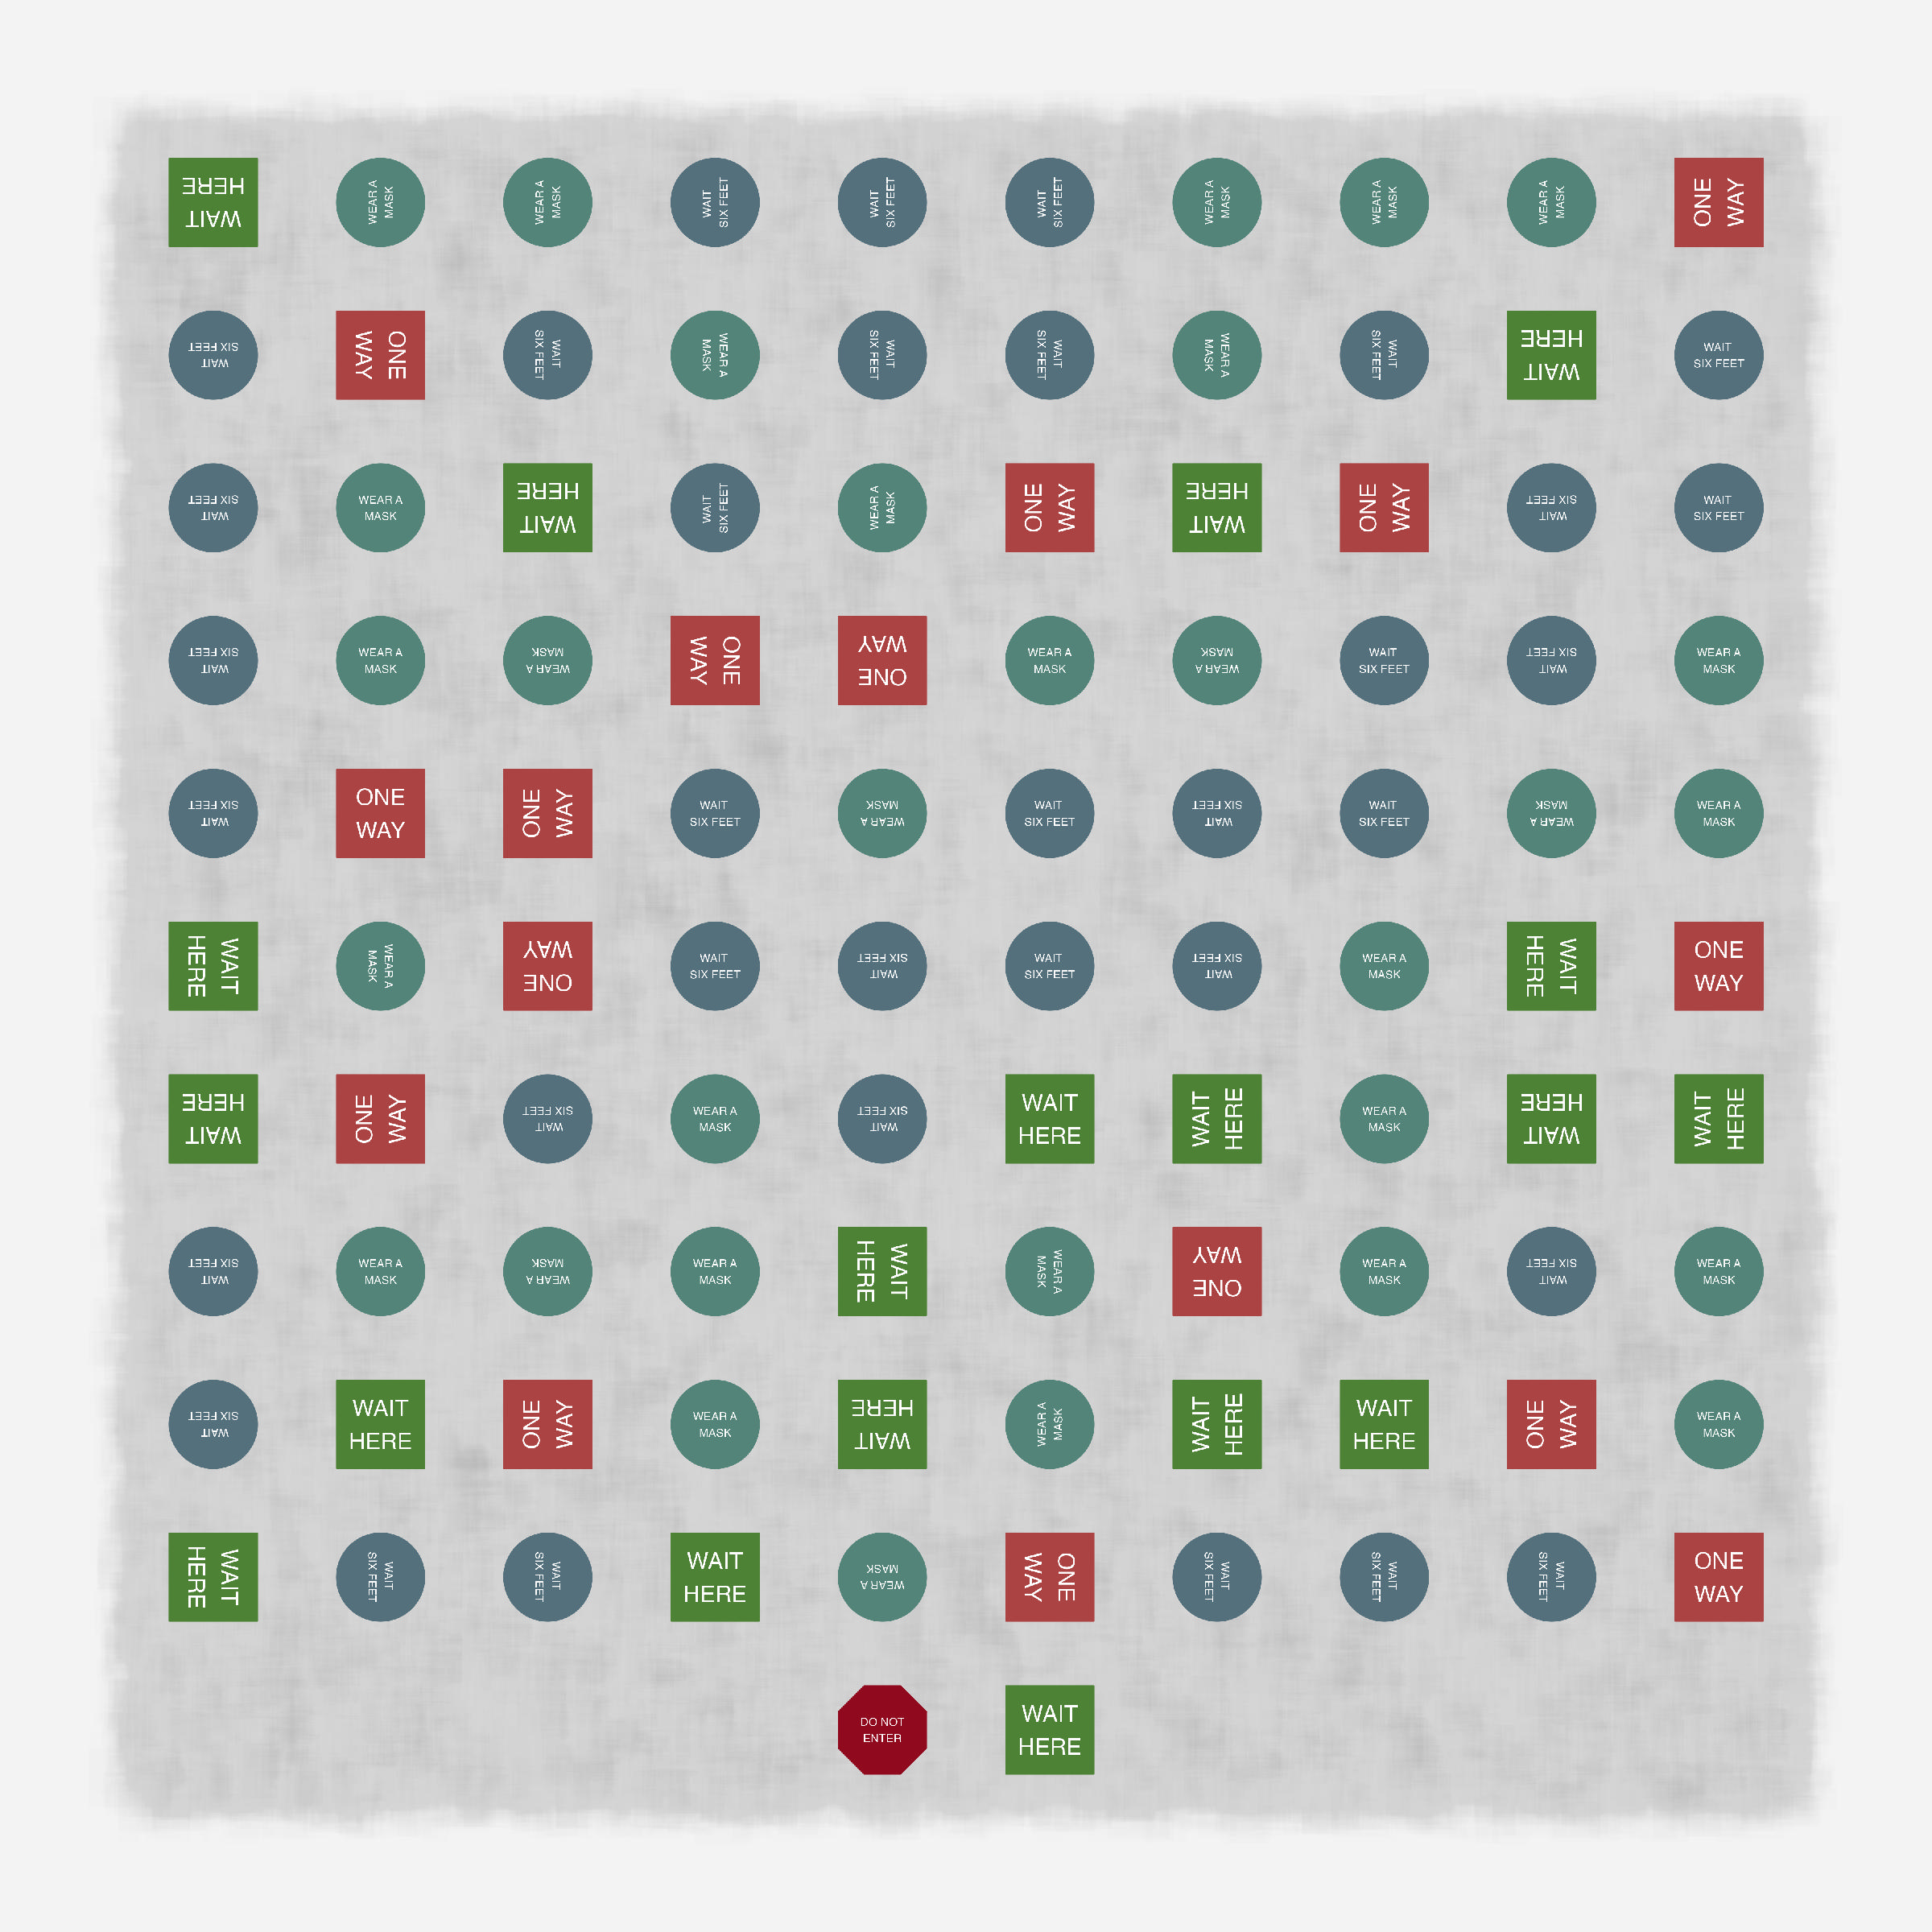
Pandemic Mazes
Generative art based on grocery store floor signs
May 3, 2022
Cohesive Graphs
Connecting graphs throughout a document
Mar 1, 2022
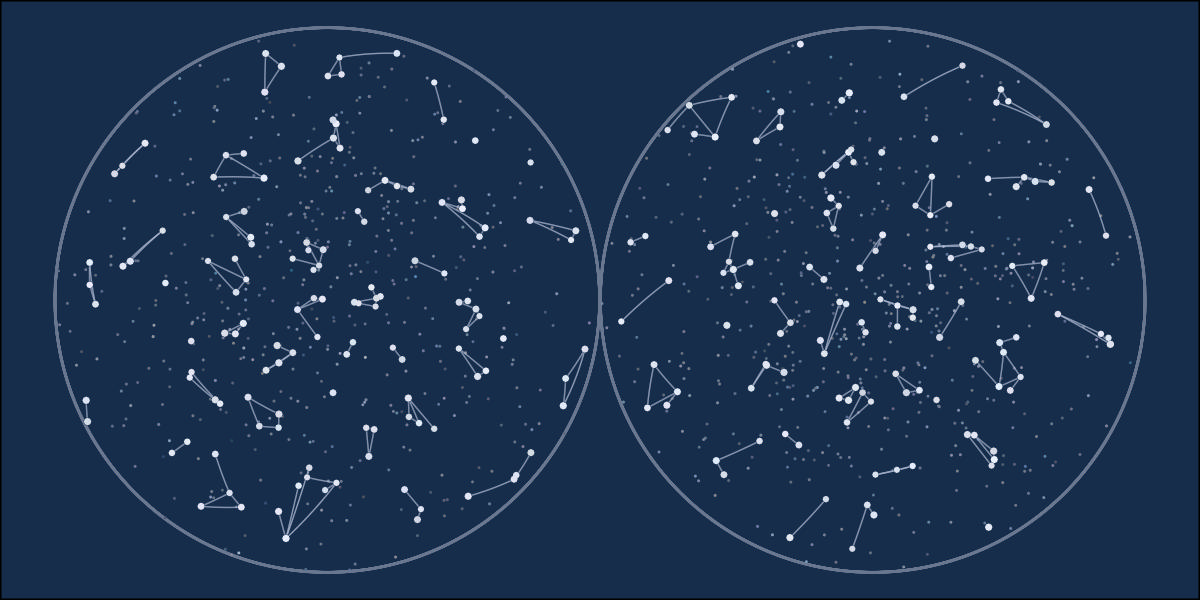
Constellations
Generative art project based on constellations
Feb 28, 2022
AZ-900 Exam Flashcards
R code to create a flashcard presentation
Dec 20, 2021
Deep Blue versus Garry Kasparov
Generative art based on chess games
Dec 9, 2021
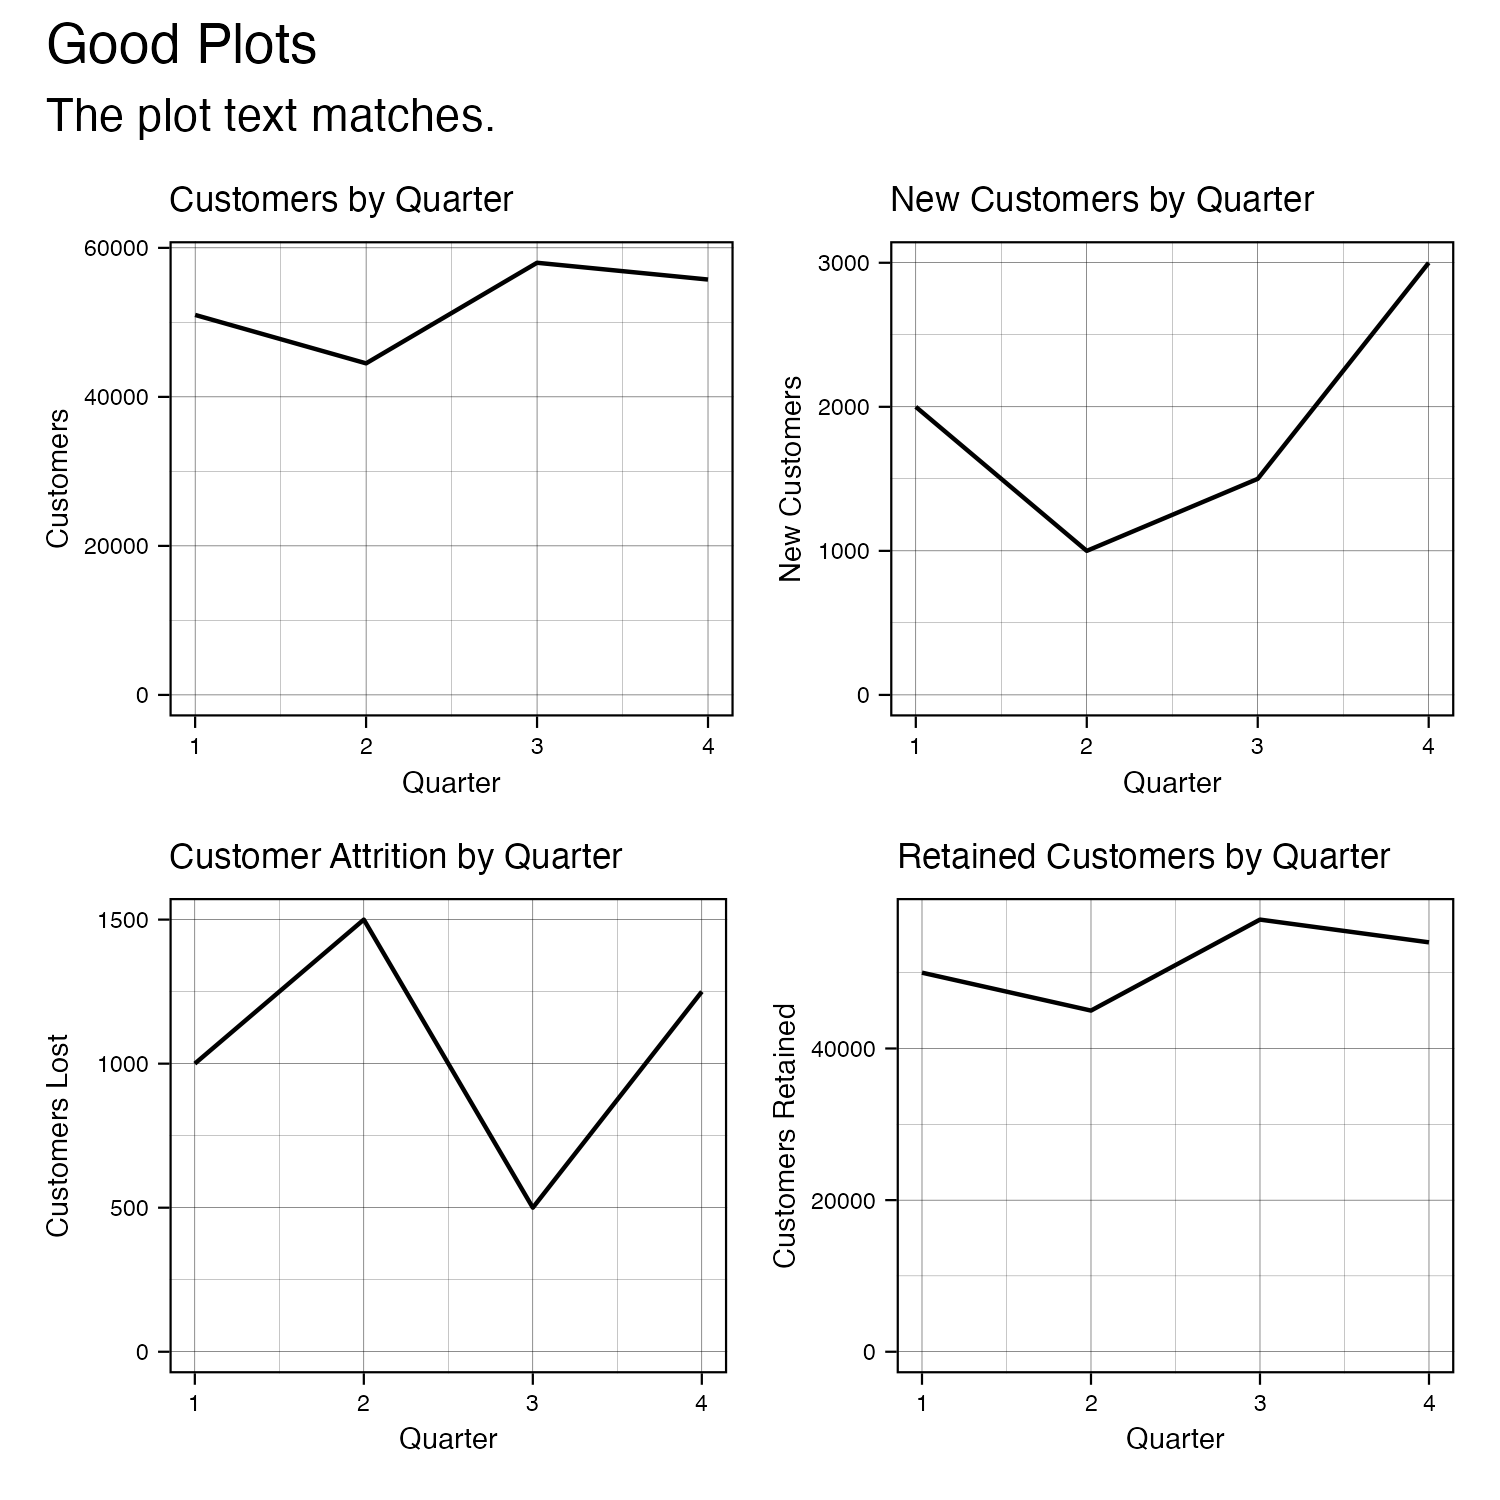
Power BI and Missing Values
Presentation write-up on Power BI and Missing Values
Oct 19, 2021
Penrose Tiling
R package for Penrose tiling patterns
Oct 19, 2021
Bertrand Paradox
Generative art based on the Bertrand Paradox
Aug 12, 2021
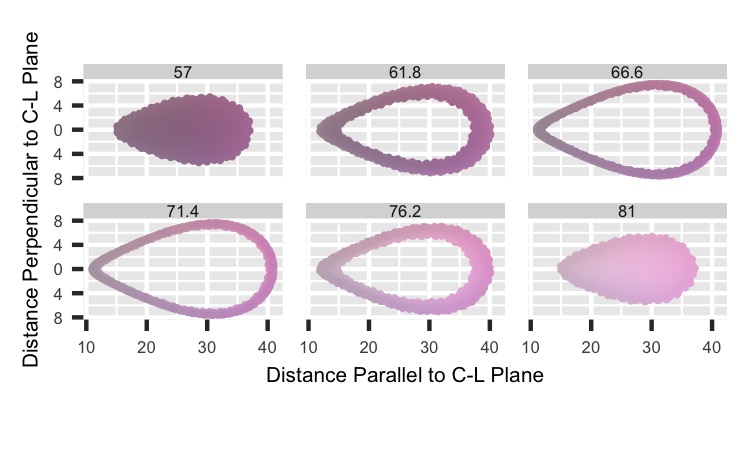
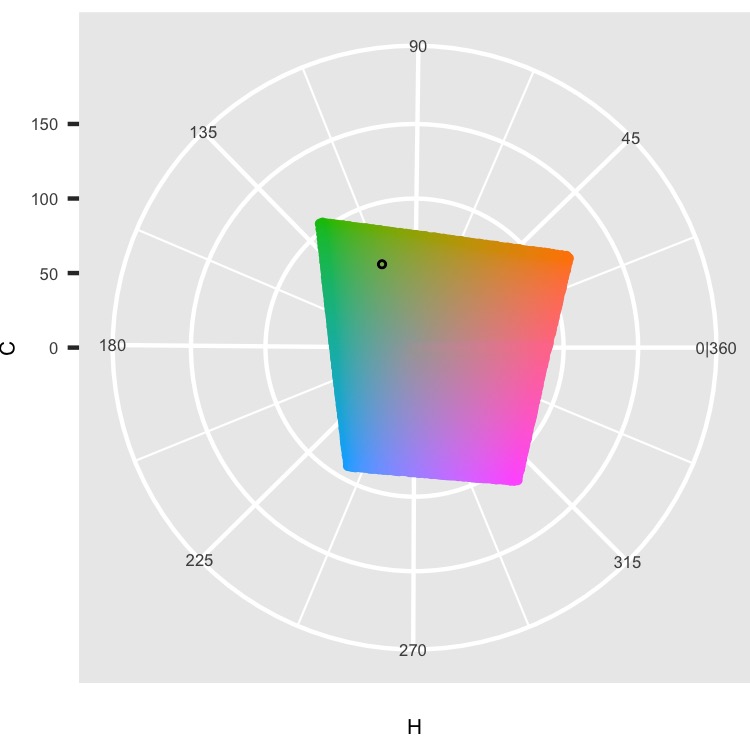
Choosing Nearby Colors Part 2
Follow-up from previous post using the HCL coordinates directly
Aug 10, 2021
Choosing Nearby Colors Part 1
Attempting to select colors close to a chosen one by sampling colors in a ellipse in the HCL color space
Aug 9, 2021
SQL Server’s Machine Learning Services Presentation
Presentation write-up on SQL Server’s Machine Learning Services
Jun 28, 2021
GENUARY 2021
GENUARY 2021: Art and Experience
Jan 31, 2021
Calathea Theme
An elegant theme for growth and flow.
May 15, 2020
Website Design: Part 2
This post continues the work from the previous one. This code takes the saved data and creates the images.
Apr 17, 2020
Website Design: Part 1
This blog post and the next one cover the code for making the site images. The first post pulls the data, and the second one creates the images. The setup first pulls the contents from the
Data Science
page of Wikipedia to get the letter frequencies. The code then pulls the overall letter frequencies for the English language. Finally, it saves them together to graph later.
Apr 16, 2020
No matching items